A demo
A random jupyter notebook to demonstrate that notebooks can be also be added to the generated sphinx documentation.
[1]:
import numpy as np
import matplotlib.pyplot as plt
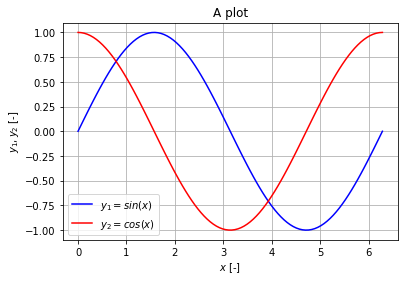
A random plot
A plot of the following variables:
\[y_1 = sin(x)\]
\[y_2 = cos(x)\]
[3]:
x  = np.linspace(0,2*np.pi,100)
y1 = np.sin(x)
y2 = np.cos(x)
fig = plt.figure()
plt.plot(x,y1,'b',label=r'$y_1 = sin(x)$')
plt.plot(x,y2,'r',label=r'$y_2 = cos(x)$')
plt.xlabel(r'$x$ [-]')
plt.ylabel(r'$y_1, y_2$ [-]')
plt.title('A plot')
plt.legend()
plt.grid('on')